Page 64 - 112100111
P. 64

52

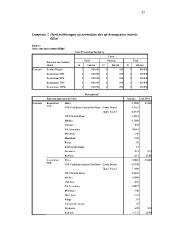
Lampiran 7. Hasil perhitungan uji normalitas dan uji homogenitas metode
                difusi

Explore
Rata-rata daya hambat Difusi

                                 Case Processing Summary

                                                              Cases

          Rata-rata daya hambat            Valid              Missing               Total
          Difusi                                                             N Percent
          Kontrol Negatif               N Percent N Percent
          Konsentrasi 25%                                                        5 100.0%
S.mutans  Konsentrasi 50%               5         100.0%   0            .0%      5 100.0%
          Konsentrasi 75%                                                        5 100.0%
          Konsentrasi 100%              5         100.0%   0            .0%      5 100.0%
                                                                                 5 100.0%
                                        5         100.0%   0            .0%

                                        5         100.0%   0            .0%

                                        5         100.0%   0            .0%

                                            Descriptivesa

          Rata-rata daya hambat Difusi                                       Statistic Std. Error

S.mutans  Konsentrasi  Mean                                                  6.5200 .03742
          25%          95% Confidence Interval for Mean Lower Bound
                                                                             6.4161

                                                           Upper Bound       6.6239

                       5% Trimmed Mean                                       6.5222

                       Median                                                6.5000

                       Variance                                              .007

                       Std. Deviation                                        .08367

                       Minimum                                               6.40

                       Maximum                                               6.60

                       Range                                                 .20

                       Interquartile Range                                   .15

                       Skewness                                              -.512       .913

                       Kurtosis                                              -.612       2.000

          Konsentrasi  Mean                                                  7.0400 .02449
          50%          95% Confidence Interval for Mean Lower Bound
                                                                             6.9720

                                                           Upper Bound       7.1080

                       5% Trimmed Mean                                       7.0389

                       Median                                                7.0000

                       Variance                                              .003

                       Std. Deviation                                        .05477

                       Minimum                                               7.00

                       Maximum                                               7.10

                       Range                                                 .10

                       Interquartile Range                                   .10

                       Skewness                                              .609 .913

                       Kurtosis                                              -3.333      2.000
   59   60   61   62   63   64   65   66   67   68   69